Fact check: Voter turnout rates in Indiana

November 6, 2015
By Charles Aull
Was Indiana's voter turnout in 2014 the lowest in the country? Are "fewer and fewer" Hoosiers showing up to vote every year? Did only 28 percent of Indiana voters head to the polls on election day in 2014?
Yes, yes and yes, according to Indiana Democratic candidate for governor John Gregg.
Our research, however, reveals a more complicated situation in the Hoosier state. The 28 percent number that Gregg cited is close enough to the percentages that we tracked down, but we found the data to be inconclusive for his other two points.
Background
Gregg, a former Indiana state representative who is making his second attempt for the governorship, commented on the issue of voter turnout in an op-ed that he posted to his campaign website on September 9. He wrote:
| “ | In just a few short weeks Hoosiers will be electing mayors, city councilors and other important local officials that many argue – myself included – have more of a direct impact on our daily lives than say a President, U.S. Senator or even a Governor.
The problem is that regardless of the office or the year, fewer and fewer Hoosiers are going to the polls and participating in these critical elections. In fact, in 2014 Indiana was dead last in the nation in voter turnout. Only 28 percent of registered voters actually cast ballots.[1] |
” |
The statement preceded Gregg's presentation of a six-point plan that he argued would help increase voter turnout in Indiana.
Gregg is not the only person to have remarked on Indiana's voter turnout in 2014. Several media outlets in the state have made comparable statements. A writer for The Indianapolis Star wrote the week after the November 2014 elections, "we [Hoosiers] may be No. 1 in failing to do our civic duty," and a writer for a local outlet in Fort Wayne wrote in advance of the city's municipal primary elections this May, "As we head into the May primary, Indiana's voter turnout will be poor if history is any predictor of the future."
But what does the data say about voter turnout in Indiana?
Voter turnout data
We reached out to Gregg's campaign to find out what his source was but have not yet heard back. When we do, we will update this article. In the meantime, we turned to the United States Elections Project, an online database of voter turnout percentages in the U.S. from 1980 to the present. The project is run by Michael McDonald, an associate professor of political science at the University of Florida and a non-resident senior fellow at the Brookings Institution.
The Elections Project uses a uniform system to measure voter turnout in all fifty states, thus allowing us to compare states to one another and to rank them. Below, we highlight two unique aspects of the project's methodology.
First, it breaks down the voting population into two metrics: voting-eligible population (VEP) and voting-age population (VAP). As McDonald explains on the project's website, VEP includes all residents of a state who are legally eligible to vote, including residents submitting absentee ballots such as members of the military or civilians living outside the country. This category excludes "non-citizens, felons (depending on state law), and mentally incapacitated persons." VAP, on the other hand, is much broader and includes all residents 18-years-of-age or older.
| VEP | VAP |
|---|---|
|
|
McDonald notes that VEP offers a more precise metric than VAP, especially when it comes to comparing voter turnout state-by-state. Using the latter to compare state turnout rates, he argues, fails to take into account the fact that ineligible voting populations are "not uniformly distributed across the United States." One state, for example, could have a significantly higher percentage of voting-ineligible felons and noncitizens than another, and VAP would not reflect this. Moreover, VAP does not include members of the military or civilians living overseas. The project includes VAP as a metric only because a number of polling firms use it.
Second, the Elections Project compares voting populations to the number of total ballots counted and the number of voters who checked a box for the highest office on their ballot.
As with VEP and VAP, the differences between total ballots counted and votes for highest office are significant, and the project favors one over the other. In this case, the more reliable metric is total ballots counted, because it most accurately reflects the actual number of voters who legally submitted a ballot. Total ballots counted includes incomplete ballots, indecipherable ballots and ballots with errors (e.g., the selection of too many candidates). Not included are ballots suspected of fraud or ones considered illegal. In contrast, the "highest office" metric only records ballots that voted for the highest office. What highest office means fluctuates significantly from year-to-year and state-to-state. In a presidential election cycle, the playing field is level, and the presidency serves as the highest office. In midterms elections, highest office "is the largest vote total for a statewide office." Usually, this is a governor or senator, but it can also be an attorney general or a secretary of state. In years where a state lacks a statewide race, the project uses "the sum of the congressional races," meaning it takes the vote totals from each congressional district in a state and combines them.
There are two caveats with the total ballots counted metric that are necessary to point out. One is that not every state reports this data, and some do so irregularly or inconsistently. A second is that the Elections Project combines the metric of total ballots counted with VEP only, not VAP.
In seeking out additional sources for voter turnout data, we looked to individual secretary of state websites and the U.S. Census Bureau's biannual Current Population Survey (CPS), but neither proved as useful as the Elections Projects. States use different reporting and calculation methods, which make state-by-state comparisons difficult, and CPS is a monthly survey of 50,000 households and does not represent hard numbers on voter turnout. We include CPS data in one instance below for the sake of comparison.
Voter turnout in Indiana
So how accurate is Gregg’s assessment of voter turnout in Indiana? To answer this question, we divided his statement into three points:
- "The problem is that regardless of the office or the year, fewer and fewer Hoosiers are going to the polls and participating in these critical elections."
- "In fact, in 2014 Indiana was dead last in the nation in voter turnout."
- "Only 28 percent of registered voters actually cast ballots."
We tackle these points in reverse, starting with number three.
"Only 28 percent of registered voters actually cast ballots."
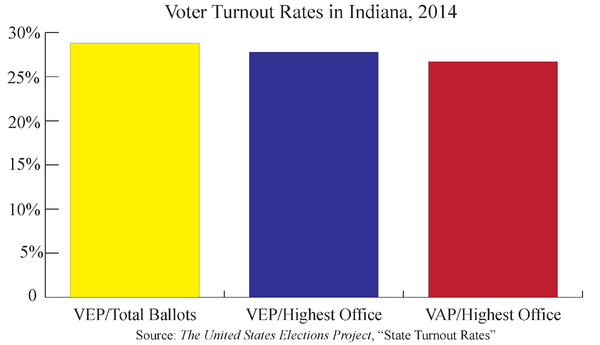
Indiana voter turnout figures provided by the Elections Project dance around 28 percent, but we think they are close enough to say that this part of Gregg's claim is accurate. The project shows 28.8 percent of VEP for total ballots counted, 27.8 percent of VEP for highest office and 26.7 percent of VAP for highest office.
Figure 1.

"In fact, in 2014 Indiana was dead last in the nation in voter turnout."
This point is more difficult to fact check.
The most comprehensive metric for assessing Indiana's voter turnout rate in 2014 in relation to other states, according to the Elections Project, is a combination of VEP and total ballots counted. As we noted above, Indiana registered 28.8 percent for this metric, which was the lowest number we could find for 2014 in the Elections Project's database. However, three states—New Mexico, Mississippi, and Texas—have no results recorded for VEP/total ballots counted because in 2014 these states did not keep records of total ballots counted. It is possible that Texas had a lower rate for this metric than Indiana. For VEP/highest office, Texas registered 28.3 percent, 0.5 points higher than Indiana. For VAP/highest office, it registered 23.8 percent, 2.9 points lower than Indiana. It is therefore within the realm of possibility that Texas voter turnout, when measured by VEP and total ballots counted, is "dead last" in the nation and not Indiana's.
| Voter Turnout, 2014: Indiana and Texas | |||
|---|---|---|---|
| State | VEP/Total Ballots Counted | VEP/Highest Office | VAP/Highest Office |
| Indiana | 28.8 | 27.8 | 26.7 |
| Texas | - | 28.3 | 23.8 |
| Sources: United States Elections Project, "State Turnout Rates."] | |||
Seeing that the metrics of VEP and total ballots counted were inconclusive on this issue, we turned to VEP and highest office. The map below shows voter turnout by the metrics of VEP and highest office for every state in 2014. By these metrics, Indiana was indeed "dead last," falling 0.4 percentage points behind New York's 28.2 percent and 8.1 points behind the national average of 35.9 percent.
But there is another complicating factor. In 2014, Indiana was one of only five states that had neither a gubernatorial race nor a U.S. Senate race. Indiana's highest statewide office last year was for secretary of state, which raises the question of whether it's reasonable to compare it to other states with more high profile statewide offices on the ballot. We took this into consideration and compared Indiana's VEP/highest office metrics to the other four states without gubernatorial or senate races. As the table below shows, Indiana still comes in with the lowest voter turnout rate at 27.8 percent, 1.8 percent lower than Utah, whose highest office in 2014 was the attorney general.
| Voter Turnout, 2014: States without gubernatorial or U.S. Senate races | ||
|---|---|---|
| State | VEP/Highest Office | Office |
| Indiana | 27.8 | Secretary of State |
| Utah | 29.6 | Attorney General |
| Missouri | 31.8 | State Auditor |
| Washington | 41.2 | U.S. House |
| North Dakota | 43.8 | Attorney General |
| Sources: United States Elections Project, "State Turnout Rates." Ballotpedia.org, "Links to all election results, 2014." | ||
The same problem with the metrics of VEP/highest office applies to VAP/highest office—is it reasonable to compare Indiana to other states with more high profile statewide offices on the ballot? By the metric of VAP/highest office, Indiana comes in fourth place nationally for lowest voter turnout at 26.7 percent, behind Texas, Nevada and New York. But when compared to states without gubernatorial or U.S. Senate races, it ranks last again. Bear in mind, however, that the Elections Project found VAP to be the least accurate data point for measuring voter turnout.
| Voter Turnout, 2014: Top 4 lowest states by VAP/Highest Office | ||
|---|---|---|
| State | VAP/Highest Office | Office |
| Texas | 23.8 | Governor |
| New York | 24.6 | Governor |
| Nevada | 25.2 | Governor |
| Indiana | 26.7 | Secretary of State |
| Voter Turnout, 2014: States without gubernatorial or U.S. Senate races | ||
| State | VAP/Highest Office | Office |
| Indiana | 26.7 | Secretary of State |
| Utah | 27.5 | Attorney General |
| Missouri | 30.5 | State Auditor |
| Washington | 37.1 | U.S. House |
| North Dakota | 42.7 | Attorney General |
| Sources: United States Elections Project, "State Turnout Rates." Ballotpedia.org, "Links to all election results, 2014." | ||
For the sake of comparison, we also include here data from the Census Bureau's Current Population Survey, which shows Indiana as having the fourth lowest turnout rate in 2014 at 35.1 percent, just above Oklahoma, Texas and New York.
So, was Indiana "dead last in the nation in voter turnout" in 2014? One set of metrics is inconclusive. A second set says yes. A third set says no nationally, but yes if you compare Indiana to states without gubernatorial or U.S. Senate races. A fourth, which is based on Census Bureau survey data, says no. Our conclusion: voter turnout in Indiana was definitely among the lowest in the country in 2014. Was it the lowest? We can't say for certain.
"The problem is that regardless of the office or the year, fewer and fewer Hoosiers are going to the polls and participating in these critical elections."
Finally, we turn to Gregg's comment about "fewer and fewer Hoosiers" going to the polls on election day "regardless of the office or the year." As with the previous point, this one is also difficult to fact check.
Gregg did not provide a time frame, but the Elections Project's database covers 1980 to 2014, so, out of necessity, we will use those years as our boundaries. We will also disregard the metrics of VEP/highest office and VAP/highest office and instead focus solely on VEP and total ballots counted.
In our first attempt to fact check this statement, we took Gregg literally and did not distinguish between presidential and non-presidential election years. As seen in Figure 3, the results revealed that voter turnout in Indiana has fluctuated since 1980, but the manner in which it has fluctuated has remained largely consistent. One notable exception to his is the drop in 2014, which appears noticeably sharper than usual but alone is not necessarily indicative of a trend.
Figure 3.
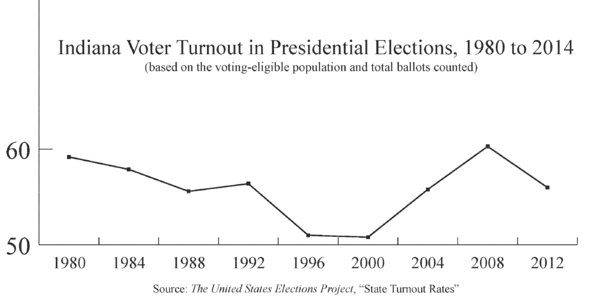
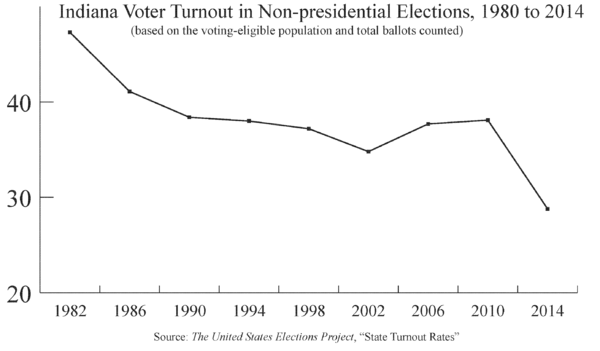
 When we break down the data into presidential and non-presidential cycles, as seen in Figures 4 and 5, that picture begins to change. The turnout in Indiana has hovered between 50 and 60 percent in presidential cycles throughout the past thirty years, while turnout in non-presidential cycles has trended downwards from 47.3 percent in 1982 to 28.8 percent in 2014.
Figure 4.
 Figure 5.
 What does this all mean, then, for Gregg's comment on voter turnout trends in Indiana? In a sense, he's incorrect. A look at voter turnout trends in Indiana "regardless of the office or the year" shows few perceptible changes since 1980 (with the exception of 2014). We can make a similar conclusion about Indiana voter turnout in presidential election years. The rates reveal little change in the past three decades. With that being said, turnout rates in non-presidential elections have dropped close to 20 percentage points since 1980. Our conclusion: Gregg was half-correct when he said, "regardless of the office or the year, fewer and fewer Hoosiers are going to the polls."
Conclusion
In an op-ed from September, Indiana gubernatorial candidate John Gregg stated, "The problem is that regardless of the office or the year, fewer and fewer Hoosiers are going to the polls and participating in these critical elections. In fact, in 2014 Indiana was dead last in the nation in voter turnout. Only 28 percent of registered voters actually cast ballots."
We found Gregg to be correct on the 28 percent voter turnout number, but we could not come to any solid conclusions about the factuality of the rest of his statement. Based on one set of metrics, voter turnout in Indiana was the lowest in the country in 2014, just as Gregg stated; yet based on another it wasn't and two other sets of metrics were inconclusive. Similarly, he's half correct about turnout trends in the Indiana. Since 1980, "fewer and fewer Hoosiers" have voted in midterm elections, but turnout for presidential elections has remained static.
Launched in October 2015 and active through October 2018, Fact Check by Ballotpedia examined claims made by elected officials, political appointees, and political candidates at the federal, state, and local levels. We evaluated claims made by politicians of all backgrounds and affiliations, subjecting them to the same objective and neutral examination process. As of 2024, Ballotpedia staff periodically review these articles to revaluate and reaffirm our conclusions. Please email us with questions, comments, or concerns about these articles. To learn more about fact-checking, click here.
Sources
The Indianapolis Star, "Was Indiana No. 1 in failing to do our civic duty?" November 12, 2014
Wane.com, "Report: Indiana last in voter turnout," April 6, 2015
United States Elections Project, "Home," accessed November 3, 2015
U.S. Census Bureau: Current Population Survey, "Voting and Registration," accessed November 3, 2015
Ballotpedia.org, "Links to all election results, 2014," accessed November 3, 2015
Contact
More from Fact Check by Ballotpedia
| Fact-checking Ben Sasse's floor speech in the Senate on November 3, 2015 November 6, 2015 |
| Up and down: federal deficits from 2007 to 2015 October 30, 2015 |
| Is NASA's budget less than 2 percent of the federal budget? October 30, 2015 |
Follow us on Facebook and Twitter
Notes
- ↑ Note: This text is quoted verbatim from the original source. Any inconsistencies are attributable to the original source.


